 d926cd7e69
- Revised environment variables reference to clarify `HAPROXY_STATS_CORS_ORIGIN` requirements for the dashboard.
- Enhanced README with details about the real-time monitoring dashboard and its capabilities.
- Added a new "Monitoring Dashboard" guide, providing setup steps, login instructions, and feature overviews.
- Included images for dashboard visuals (`dashboard_thumbnail.png`, `dashboard_login.png`).
6.6 KiB
| sidebar_position | sidebar_label |
|---|---|
| 0 | Monitoring Dashboard |
HAProxy Monitoring Dashboard
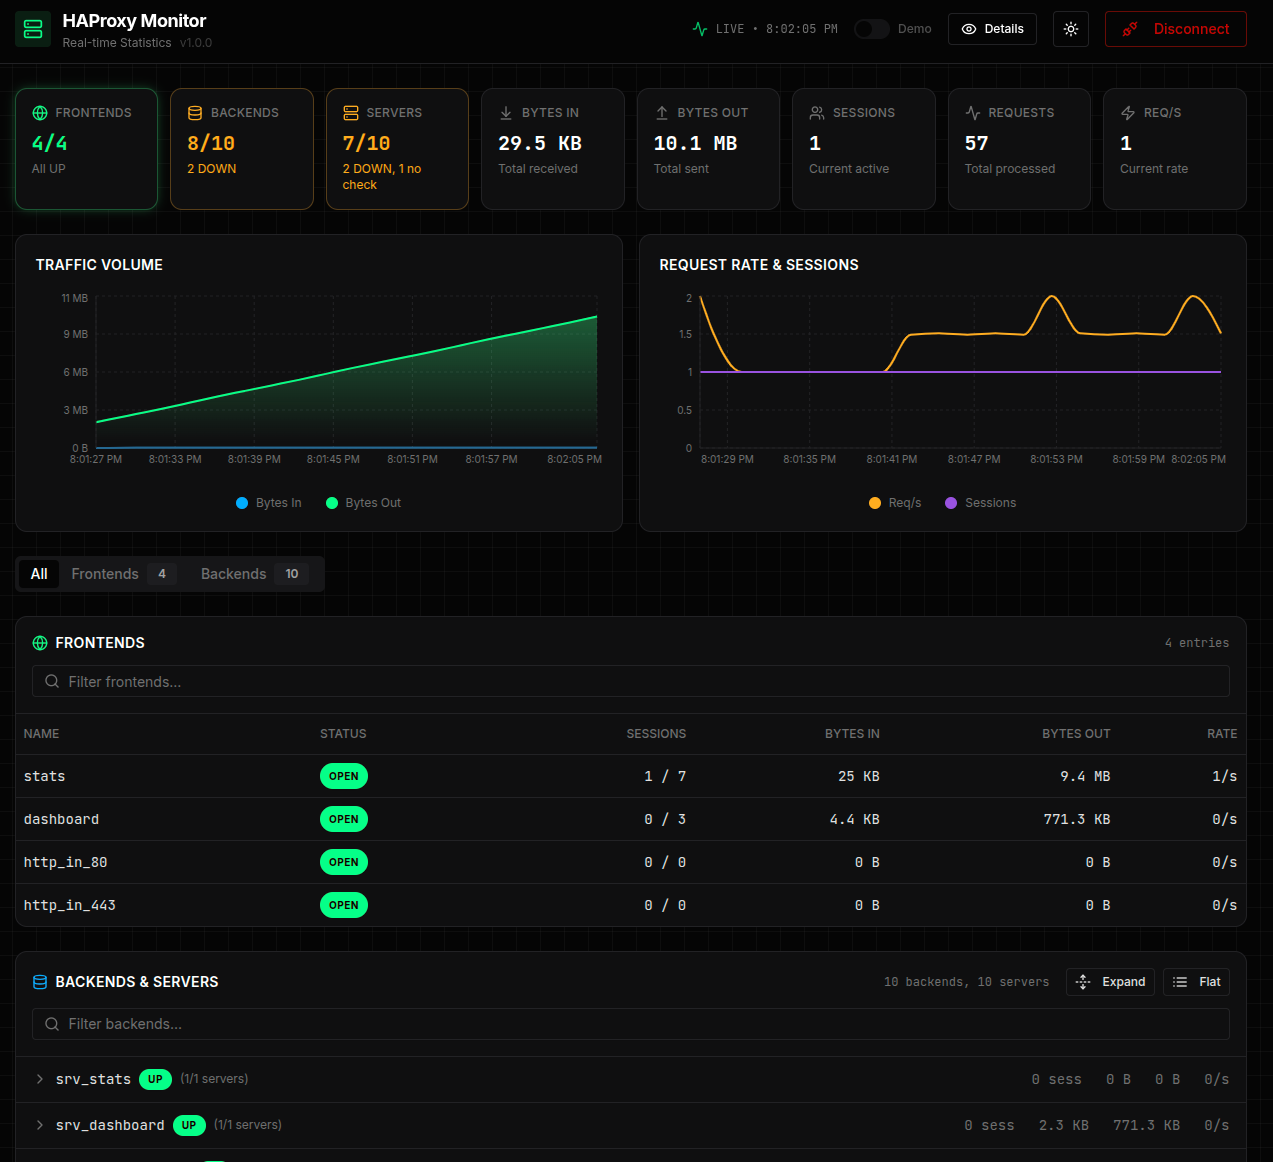
EasyHAProxy ships a real-time monitoring dashboard that gives you a live view of your HAProxy instance — frontends, backends, servers, traffic volume, request rates, and more — all from a single page, with no extra software required.
Enabling the dashboard
Two environment variables are required:
| Variable | Purpose |
|---|---|
HAPROXY_PASSWORD |
Enables the stats endpoint and the dashboard. |
HAPROXY_STATS_CORS_ORIGIN |
Allows the dashboard page to call the stats API. Required — without it the browser blocks the requests and the dashboard shows no data. |
The dashboard page is served from port HAPROXY_STATS_PORT + 10000, but it fetches data from
the stats API at HAPROXY_STATS_PORT. Because those are different ports, the browser treats
them as different origins and enforces CORS. Set HAPROXY_STATS_CORS_ORIGIN to the exact origin
you will use to open the dashboard.
docker run \
  -e HAPROXY_PASSWORD=secret \
  -e HAPROXY_STATS_CORS_ORIGIN=http://localhost:11936 \
  ... byjg/easy-haproxy
If you access the dashboard from a non-localhost address (e.g. a server IP or hostname), match that origin instead:
-e HAPROXY_STATS_CORS_ORIGIN=http://192.168.1.10:11936
Accessing the dashboard
The dashboard is served on a dedicated port: HAPROXY_STATS_PORT + 10000.
HAPROXY_STATS_PORT (default 1936) |
Dashboard URL |
|---|---|
1936 |
http://<host>:11936/ |
8080 |
http://<host>:18080/ |
Open http://<host>:11936/ (or http://<host>:11936/dashboard.html) in your browser.
Requests to / and /index.html are automatically redirected to the dashboard page.
Any other path returns a 404.
Login
The first time you open the dashboard (or after disconnecting), a Connect to HAProxy dialog appears:
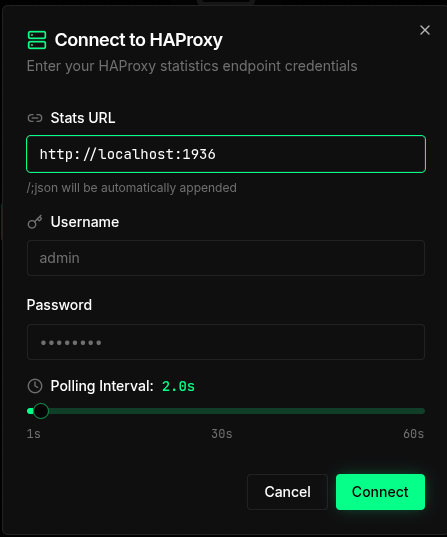
Fill in the three fields:
| Field | What to enter | Example |
|---|---|---|
| Stats URL | The stats API base URL — http://<host>:<HAPROXY_STATS_PORT>. The dashboard appends /;json automatically. |
http://localhost:1936 |
| Username | The value of HAPROXY_USERNAME. |
admin |
| Password | The value of HAPROXY_PASSWORD. |
secret |
You can also adjust the Polling Interval (1 s – 60 s) to control how often the dashboard refreshes live data. Click Connect to open the main view.
:::info Why enter the Stats URL manually? The dashboard HTML is static — it has no knowledge of which host or port HAProxy is running on. Entering the URL at login time makes the dashboard work in any environment without any server-side configuration. :::
:::info Why a separate port?
The stats API (HAPROXY_STATS_PORT) speaks the native HAProxy stats protocol.
The dashboard port (+10000) is a plain HTTP frontend that proxies to an embedded Python
HTTP server running inside EasyHAProxy. This split keeps the two concerns cleanly separated
and avoids HAProxy's 16 KB inline-file limit.
:::
What you can see
Summary cards
At the top of the page, eight cards give an instant health snapshot:
| Card | Description |
|---|---|
| FRONTENDS | Number of open frontends vs. total, with an "All UP" indicator |
| BACKENDS | Number of backends that are UP vs. total; highlights DOWN backends in orange |
| SERVERS | Server health across all backends — UP, DOWN, and "no check" counts |
| BYTES IN | Cumulative bytes received since last HAProxy start |
| BYTES OUT | Cumulative bytes sent since last HAProxy start |
| SESSIONS | Current active sessions |
| REQUESTS | Total HTTP requests processed |
| REQ/S | Current request rate |
Charts
Two real-time charts update every few seconds:
- Traffic Volume — bytes in and bytes out plotted over time
- Request Rate & Sessions — req/s and concurrent sessions plotted over time
Frontends & Backends table
A tabbed table lets you drill into every frontend and backend:
- All tab — frontends first, then backends and their servers
- Frontends tab — name, status (OPEN/CLOSED), sessions, bytes in/out, request rate
- Backends & Servers tab — backend health (UP/DOWN), session count, traffic, per-server detail with Expand / Flat toggle
You can filter by name using the search box above each section.
What makes this unique
Most HAProxy installations expose only the raw stats page (tables of numbers) or require a separate Grafana + Prometheus stack for visualization. EasyHAProxy bundles a polished, self-contained dashboard that:
- requires zero extra containers — it runs inside the EasyHAProxy process itself
- uses HAProxy's own stats socket — no metrics scraping pipeline
- works out of the box — enable with a single environment variable
- is accessible over a plain HTTP connection — no TLS setup needed for internal monitoring
Environment variables
| Variable | Description | Default |
|---|---|---|
HAPROXY_PASSWORD |
Enables stats and the dashboard. Required. | empty |
HAPROXY_USERNAME |
Username for the stats endpoint. | admin |
HAPROXY_STATS_PORT |
Stats API port. Dashboard is served on this port + 10000. | 1936 |
HAPROXY_STATS_CORS_ORIGIN |
Required for the dashboard. Set to the exact origin you use to open the dashboard (e.g. http://localhost:11936). Without this the browser blocks stats API calls and the dashboard shows no data. |
empty |
See the full Environment Variables reference for details.